As Student Response Systems Expand Features and Question Types, Multiple Choice Continues to be the Gold Standard for Calculations from both Student and Instructor Perspectives
Kyle Anderson
University of Saskatchewan
Copyright 2021 The Author(s). CC-BY-NC-ND License 4.0 This is an open access work distributed under the terms of the Creative Commons Attribution-NonCommercial-NoDerivatives 4.0 International License, which permits copy and redistribution with appropriate credit. This work cannot be used for commercial purposes and cannot be distributed if the original material is modified.
Abstract
Student response systems (SRS) continue to evolve as bring-your-own-device (BYOD) systems allow more question and answer types to be utilized. While users were once limited to a button press on a clicker selecting from a list of predetermined responses, students can now generate text and numerical responses on their personal devices. Question and response types are now limited only by software, and new features can be added without requiring an overhaul of the existing system. Using two successive course offerings of a biomedical lab techniques class, the effect of question type was evaluated, using a crossover experimental design, and applied to novel discipline-specific calculations. Students used the Top Hat student response system (tophat.com) to answer either multiple choice questions (MCQ) or numerical response questions (NRQ) in class. Student responses were tracked for elapsed time to completion, performance, and subsequent test performance. Additionally, students were surveyed about their question-type preference. Analysis shows that on formative assessments, students take less time on multiple choice questions, are successful more often, and show a clear preference for this type. When students used those calculations on summative exams, they performed similarly regardless of whether they initially used MCQ or NRQ. Students also expressed clear preference for MCQ. The use of NRQ is still recommended to be used strategically as it increases question difficulty and diversity. The findings from this study may assist STEM instructors looking to formulate their own evidence-based best practices when incorporating SRSs into their pedagogy.
Keywords: clickers, engagement, active learning, student response system, BYOD, Top Hat
Introduction
Over two decades, post-secondary enrollments in Canada increased from 1.31 million in 1996/97 to 2.05 million students in 2016/17 (Statistics Canada, 2020). As campuses continue to welcome additional students, the number of and enrollment in large, lecture-based courses is increasing. Anecdotal and empirical reports suggest the detrimental effects of increasing class sizes on student learning (Bedard & Kuhn, 2008; Monks, 2010; Sapelli & Illanes, 2016), and the unique challenges posed by larger classrooms on student learning have been detailed for decades. It is well established that larger classes can create an impersonal divide between students and instructor, and that students retreat into a more passive role as the classroom capacity grows (Geske, 1992). To counteract the detrimental effects of passive students in large lecture halls, several different strategies have been developed to increase engagement and stimulate active learning. Problem- and inquiry-based learning, flipped classrooms, and other active learning techniques are effective, but require considerable additional time, effort, and expertise on behalf of the instructor to be utilized effectively (Eberlein et al., 2008; Ebert-May et al., 1997; Smith & Cardaciotto, 2011). One method for increasing student engagement in large, traditional lecture-style classes is the utilization of student response system (SRS) technology.
SRSs have evolved from their origins, over 25 years ago, as desktop-attached keypads that could handle just a few students at once (Lane & Atlas, 1996) to modern software running on students’ personal devices that can wirelessly accommodate hundreds of students at a time. SRS evolution has benefited from the rapid advances in consumer personal devices and wireless communication. SRSs are alternatively referred to as classroom response systems, audience response systems, and most often simply as “clickers” in the literature and by the students and educators using them. No matter which name is used, the question for educators has often been framed as “Does using this technology improve the educational experience?” Unfortunately, studies to date have failed to show universal benefits of SRSs due to the vast diversity of teaching methods used, class sizes, student complement, instructional ability, course content, and more. At its core, an SRS is simply a tool, and like all tools its potential benefits are dependent on context and can only be realized through proper usage.
Previous work has found that SRS usage increases student engagement and promotes active learning (Addison et al., 2009; Gould, 2016; Llena et al., 2015; Masikunas et al., 2007; Miles & Soares da Costa, 2016) and can also improve student comprehension (Crouch & Mazur, 2001; Levine, 2011; Rana & Dwivedi, 2017). A limitation of previous studies is that students using SRSs are often compared to students who do not use them. These studies make it difficult to determine how variations in instructor utilization of SRSs might affect student perceptions and performance. As SRSs become more feature-rich, their added complexity raises the importance of methodically studying not just the question of “Should we use an SRS?” but also “How can we use an SRS most effectively?” This study sought to probe that question by methodically testing certain use-case scenarios and observing student activities, attitudes, and learning outcomes.
The motivation for the present study arose after the author transitioned from using dedicated hardware clickers to a more multifunctional application-based system called Top Hat. The Top Hat system uses a web interface to present questions on the instructor’s computer, and then students use their personal devices (smart phone, tablet, laptop) with a web interface or application to record their responses. Transitioning from a system where responses were selected from a list (multiple choice or true/false questions) and selected by a single button press on a keypad to a system that allows for student-generated responses could enhance active learning and student engagement. Questions within the Top Hat system may require multiple choice or true/false responses, but questions can also be presented as numerical response, fill in the blank, free text response, sorting, matching, and click-on-image—all depending on the instructor using the most appropriate question type for the material being presented. While unpublished reports of increased student satisfaction with the Top Hat system—compared to clickers—were promising, it was difficult from these observations to determine what students were specifically satisfied with. The current study was designed to consider the effect of various in-class SRS question types on student learning outcomes and to help develop best practices. The present focus is on student engagement and learning outcomes, specifically as it pertains to calculations required to successfully complete basic laboratory experiments in the fields of biochemistry and microbiology. Although there is no difference in the presented text of the questions being posed, it is hypothesized that, as numerical response questions are both more engaging (students must produce their answer) and difficult (the correct answer is not selectable by chance), students are likely to take additional time to complete these questions and will also be correct less often. If that hypothesis is supported, the next prediction would be that the additional engagement of numerical response questions may offer a better learning opportunity, leading to improved performance on examinations and increased student preference for these more engaging questions when compared to multiple choice SRS questions.
Methodology
Students from two successive offerings of a laboratory techniques course were recruited to participate in the study. A subset of the previously used in-class SRS calculation questions was identified and split into three groups of non-overlapping concepts. One group would be common to both offerings and utilize multiple choice questions (MCQ). One group would be MCQ for the first offering with the same questions and numerical response questions (NRQ) for the second offering. The last group of questions would be reversed—NRQ for the first offering and MCQ for the second. Additional SRS question types were utilized in class, such as word answer, but these did not vary between course offerings. Student engagement and learning would be evaluated by monitoring how quickly students answered each question, how many students answered each SRS question correctly, how students faired on those questions during summative assessments, and students’ question preference as reported on an end-of-term survey.
Participants and SRS Usage
The study cohort consisted of students registered in a second-year undergraduate course on biomedical laboratory techniques in Term 1 (117 students) or Term 2 (147 students) of the 2018/19 academic year. No students were enrolled in both cohorts. This course covers the fundamental experimental techniques used to study the fields of microbiology and biochemistry and is required only for biomedical majors. In this course students attend two 80-minute lectures and one 3-hour lab a week. The Top Hat student response system is free to use for students through a campus licensing agreement. Each lecture contains between one and five SRS questions (average = 2.6) embedded within the lecture. These formative assessment questions are designed to test students’ understanding of the material. To encourage students to use the SRS, a 5% participation grade is allocated for using the system. If a student has answered one or more questions in a lecture, they receive a participation mark for that lecture, and students must participate in >80% of lectures to get full marks. Any participation under 80% receives a proportional grade. For example, 40% participation would get 40/80*5 or 2.5 marks for in-class participation. To allow students to opt-out of using the system, they are permitted to request that the 5% be reallocated to their final examination at any point in the course up to the last day of classes.
Ethics
The design of this study was evaluated and approved by the Institutional Behavioural Ethics Review Board. All procedures performed in studies involving human participants were in accordance with the ethical standards of the institutional and/or national research committee and with the 1964 Helsinki Declaration and its later amendments or comparable ethical standards. Informed consent was obtained from all individual participants involved in the study.
Study Design
Questions were selected from calculations previously used in this course that could be adapted to both question types. To control for potential differences between the two cohorts, a crossover experimental design was selected where each cohort would be assessed with the two question types at different points in the semester. The crossover experimental design of this study had three groups of calculations (A, B, C), two student cohorts (1, 2) and questions presented as multiple choice (MCQ) or numerical response (NRQ). To identify any variation between cohorts, both 1-A and 2-A used numerical response questions. To compare the effect of question type, group 1-B-MCQ was compared against 2-B-NRQ. The crossover then reversed the types for the next set of questions, so 1-C-NRQ was compared to 2-C-MCQ.
Data Collection and Analysis
Student responses to in-class questions were automatically recorded by using the Top Hat system, and instructor access allowed student IDs, final answers, and submission time in HH:MM format to be extracted from the system. With the help of IT personnel, a Top Hat submission time to the second (HH:MM:SS) was obtained. Student submissions (response, correctness, and elapsed time), anonymized student IDs, and examination responses on multiple choice tests for the midterm and final exam were all cross-referenced to allow for of any trends or indicators to be visualized. As the number of responses for each question varied both by class size and daily attendance, the statistical analysis for each question was performed using one-way ANOVA on submission times and correctness with statistical significance set to (p < 0.05) on the open source statistics package SOFA (Statistics Open For All version 1.4.6).
Survey
Students were informed that their de-identified Top Hat responses were to be analyzed and that by completing an online survey they were providing their consent for those de-identified responses to be used in the analysis as well. The first four questions used Likert-scale ranking on a 5-point scale: Strongly Agree = 5, Agree = 4, Neutral = 3, Disagree = 2, and Strongly Disagree = 1. These four questions asked students to rate the effectiveness of the Top Hat system, numerical response questions, multiple choice questions, and a comparator non-mathematical word answer question type. The fifth survey question asked the students which question format they preferred when using the Top Hat system for questions dealing with calculations. The final question was a free-form response to solicit any comments and responses, which were subjected to thematic analysis. Student comments were read through in their entirety twice to get an overview of the dataset, then individual words and phrases were colour-annotated as having potential thematic similarities. Once these key sentiments were identified, they were coded to themes and tabulated. Themes were generated inductively from the dataset and included the following: overall opinion, motivation, learning effectiveness, frequency of SRS usage, technical issues, and specific comments about question types.
Results and Analysis
Question Type vs. Response Time and Correctness
Student responses to six paired questions (MCQ and NRQ) were compared for response time and correctness. Figure 1shows the distribution of 1474 student response submissions in seconds. The control questions used MCQ in both cohorts and had similar, non-significant response distributions between cohorts by ANOVA analysis (p = 0.72 and p = 0.81 for times, p = 0.52 and p = 0.074 for correctness, for Control 1 and 2, respectively). Comparison between the Chemistry and Microbiology calculations shows that, regardless of cohort, in all instances response times were significantly longer (p < 0.001) for the NRQ (171.4 seconds) compared to MCQ (92.6 seconds). Additionally, NRQ questions were answered correctly at a lower frequency (33.2%) compared to MCQ (50.7%) with all paired questions showing statistical significance: Chemistry 1 (p = 0.037), Chemistry 2 (p < 0.001), Microbiology 1 (p = 0.0087), and Microbiology 2 (p = 0.0067).
Figure 1. Paired Questions and Student Response Times
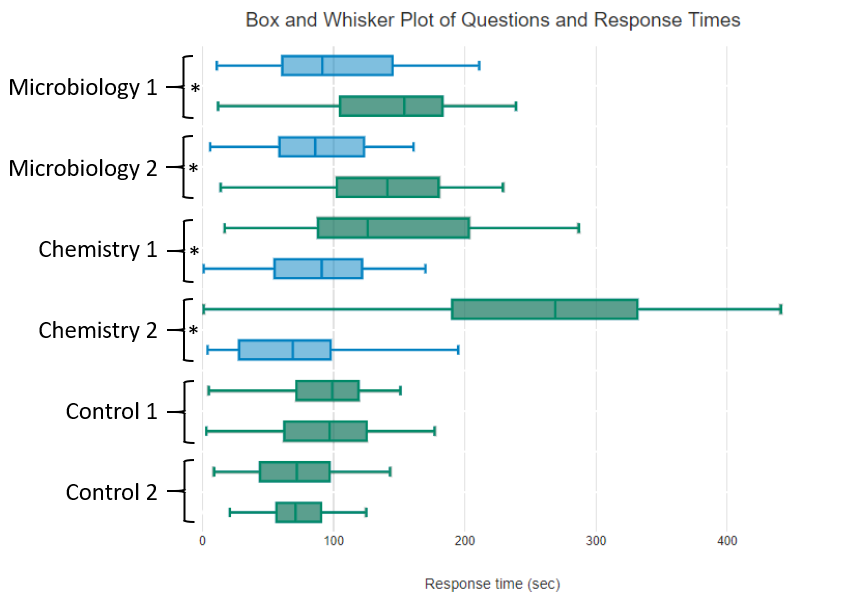
Note. Box and whisker plots show the mean response times and quartiles of student responses for six pairs of questions. Multiple choice questions (MCQ) are shown in blue and numerical response questions (NRQ) in green. In each pair the Term 1 cohort is on the top and Term 2 cohort is on the bottom. Paired sets shown with an asterisk (*) showed statistically significant variance in response times (P<0.001) by ANOVA analysis. Control question variances were not significant (P>0.05).
Examination Results
Students in each semester were given summative assessments in the form of multiple choice formatted midterm and final examinations. Only the exam questions utilizing the calculations related to the SRS questions identified as “Control,” “Chemistry,” and “Microbiology" were subject to detailed analysis. Responses were correlated and the number of correct versus incorrect responses were analyzed (see Table 1). While some variation was detected between cohorts, there was no statistical difference in performance on these exam questions relating to whether students were initially given the questions in a MCQ or NRQ.
Table 1. Examination Performance Is Unaffected by SRS Question Type Used for Formative Assessment
|
Calculation Category |
Term |
Correct |
Incorrect |
Total |
% correct |
|
Control |
1 – NRQ |
519 |
172 |
691 |
75.1% |
|
2 – NRQ |
632 |
216 |
848 |
74.5% |
|
|
Chemistry |
1 – MCQ |
525 |
290 |
815 |
64.4% |
|
2 – NRQ |
631 |
360 |
991 |
63.7% |
|
|
Microbiology |
1 – NRQ |
240 |
224 |
464 |
51.7% |
|
2 – MCQ |
300 |
266 |
566 |
53.0% |
Student Survey
Students were asked to complete a six-question survey at the end of the semester to help understand their impressions on the effectiveness of the Top Hat system to their learning and understanding. The results to the four Likert-scale questions and single question-type preference question are presented in Table 2. The first five survey questions yielded no significant differences by ANOVA testing between the two semesters, and as such the responses are presented in aggregate in Table 2. When students were asked how well they agree with the statement “I found the use of <descriptor> in class assisted my learning or understanding of the material,” the mean scores for each descriptor were as follows: <Top Hat system> (4.31), <Numerical Response Questions> (4.10), <Multiple Choice Questions> (4.45), and a free-text response comparator also used in the course <Word Answer Questions> (3.16). This indicates overall agreement to strong agreement and a highly favourable perception of the educational usefulness of Top Hat as an SRS in this course, as well as for NRQ and MCQ specifically. Interestingly, when asked the same question about word answer questions, there was only slight overall agreement (mean = 3.16) with 62 students agreeing to some extent, 45 students neither agreeing nor disagreeing, and 49 students disagreeing to some extent. The last question in Table 2 asks students if they would prefer either question type for calculation questions (NRQ or MCQ), and there was an approximately 3:1 desire for MCQ (103 preferred) instead of NRQ (36 preferred) with 18 students showing no preference.
Table 2. Combined Survey Responses on Top Hat Questions
|
Survey Question |
Strongly Agree |
Agree |
Neutral |
Disagree |
Strongly Disagree |
Mean |
|
I found the use of Top Hat in class assisted my learning or understanding of the material. |
71 |
74 |
13 |
1 |
2 |
4.31 |
|
I found the use of NUMERICAL RESPONSE Top Hat questions in class assisted my learning or understanding of the material. |
52 |
83 |
11 |
8 |
3 |
4.10 |
|
I found the use of MULTIPLE CHOICE Top Hat questions in class assisted my learning or understanding of the material. |
84 |
61 |
8 |
3 |
0 |
4.45 |
|
I found the use of WORD ANSWER Top Hat questions in class assisted my learning or understanding of the material. |
21 |
41 |
45 |
40 |
9 |
3.16 |
|
If given the option, I would prefer that Top Hat questions requiring calculations were: |
numerical |
no preference |
multiple choice |
|||
|
36 (22.9%) |
18 (11.5%) |
103 (65.6%) |
Note: Means are calculated by giving the leftmost (strongly agree) a value of 5 and rightmost (strongly disagree) a value of 1.
Thematic Analysis
The last question on the survey was a free-response request for feedback, which stated “Please submit any feedback you would like about usage or effectiveness of the Top Hat system.” Out of 161 survey responses there were 171 coded sentiments categorized into 8 themes. Those themes were also identified as being positive, negative, or neutral statements. An overview of theme frequency is presented in Table 3.
Table 3. Enumeration of Survey Comment Themes
|
Attribute |
Overall Opinion |
Motivation |
Learning |
Frequency |
Technical |
Word Response |
NRQ Response |
MCQ Response |
|
Positive |
57 |
16 |
39 |
12 |
0 |
1 |
3 |
9 |
|
Neutral |
0 |
1 |
0 |
1 |
1 |
0 |
0 |
0 |
|
Negative |
0 |
1 |
10 |
0 |
8 |
8 |
4 |
0 |
Overall Opinion
This refers to statements that could be categorized as either positive or negative, but that do not indicate anything specific. Three representative student responses in this theme with the coded portions underlined are “I liked it overall”; “It was helpful, thanks”; and “It is an amazing tool that I hope my future classes utilize.” In total, there were 57 positive overall opinions and no neutral or negative overall opinions.
Motivation
The motivation theme captures comments that refer to encouraging or discouraging behaviours. When students discussed aspects of the system that affected their attendance, participation, or engagement, their comments were placed in this category. The single negative comment states, “I don't think this is a great system for marking attendance. I don't like to bring my electronics out at all in class, so I found it more distracting, and I rarely submitted the answers although I frequently attended.” The one neutral comment is simply “class participation,” and three representative comments of the 16 positive ones submitted are “I enjoy TOPHAT in class as it helps me focus on the materials being presented, and it acts as a review for me when studying for exams”; “I find Tophat engaging and a good way to promote in class attendance”; and “enhanced overall learning experience. Helped me focus better in class.”
Learning
To be coded into the learning theme, a response would typically discuss learning, understanding, reviewing, feedback, or other related terms. There were 10 negative comments, and each one specifically referred to how some questions did not have a correct answer, or it was difficult to determine which answer was correct. Some questions over the semester had more than one correct answer or were open-ended to elicit novel responses from the class and had no correct answer. Two representative comments are “sometimes was unclear about the answer in class, more clarification especially if not numerical based”; and “I didn’t like the questions that didn’t have a definitive answer—made it confusing to study from.” Three representative samples of the 39 positive feedback comments are “It encouraged class participation and helped with understanding the material more (especially the numerical questions because we were able to apply the equations given in class)”; “I feel that it has only enhanced my learning”; and “TopHat is a really great tool for helping me learn in this class. It’s nice to have questions to assess my level of understanding during lectures as well as to go back to review from for tests. The more questions the better.”
Frequency
This code was used when students commented on potentially wanting the system to be used more, less, or at different times in the class. There were no comments where students indicated they wanted the system to be used less often—these would have been classified as negative comments. The single neutral comment was a student request to use the system at consistent times instead of variably throughout each lecture. There were 12 student comments indicating they would like the system to be used more often in class or in more of their classes overall.
Technical
As with any educational technology, technical issues will arise. This theme captured student comments about crashes, connection issues, or other technical issues. There were 8 negative comments. Two examples are “occasionally the internet service in the classroom has trouble dealing with everyone logging in and things crash. Perhaps allow more time?” and “sometimes was slow to load, but otherwise it works fine!” There was also a single neutral comment where the student pointed out the system could have a countdown timer for questions, but as the course instructor was allowing students to complete the questions with as much time as was needed, this feature was not activated in this course.
Text / Numerical / Multiple Choice
The final three themes were coded when students specifically commented on one of the three question types asked about in the survey. As the multiple choice question types garnered 9 positive comments and no neutral or negative comments, these were the clear student favourite. Comments praised the similarity of the in-class questions to the format of the examinations. The numerical response comments were split with 3 positive comments and 4 negative comments. The positive comments indicated this question type was effective for learning, and the negative comments referred to this question type as having increased difficulty over multiple choice questions. The least-liked question type was the text or word response questions, which received 8 negative comments and only 1 positive comment. Three representative comments mentioning question types are “I thought it was useful for multiple choice but numerical answers were too difficult to calculate in class”; “I liked the variety of questions, word answer ones were often not taken seriously, MC ones were good because that’s what the exam will look like. I liked Tophat because then you can try to solve actual problems we just learned about, instant correct/incorrect feedback”; and “In my experience, the most beneficial questions are ones that have a definitive set answer so that when reviewing the questions for studying, it is possible to definitively tell whether the answer is correct or not. Numeric/word answers are better for checking actual understanding while multiple choice is better for practicing testability.”
Discussion and Conclusion
Student engagement has been defined by Kuh (2003) as “the time and energy students devote to educationally sound activities inside and outside of the classroom” (p. 25). The use of SRSs in large lecture halls continues to be a readily accessible method to supplement traditional lecturing with a component of active learning that increases student engagement (Caldwell, 2007; Carini et al., 2006; Morrell & Joyce, 2015; Stevens et al., 2017). While instructors are able to iteratively develop their own best practices when using SRSs, it is not feasible for all instructors to test all new features. As a shortcut to optimization, instructors may rely on the findings of other educational researchers as a stepping off point for their own pedagogical refinement. Unfortunately, there is a problem in SRS research: the educational effects are insufficiently studied and understood, and this deficit causes educational research to lag behind educational innovation (Han, 2014; Keough, 2012; Landrum, 2015).
The present study specifically addressed how SRS question types can be utilized to reinforce mathematical concepts in a large undergraduate biomedical techniques course. The results of this study demonstrate, when a student is posed with a question where they are tasked to apply calculations covered in the lecture, both the perceived effectiveness of the question and the time taken to complete it are contingent upon the format of the question. The mean time to completion for NRQ was 185% the time needed for MCQ, and the upper quartile, where the slowest responding students submitted responses, was 162% for NRQ compared to MCQ. Overall, using only NRQ instead of MCQ for all formative calculations would add approximately 15–20 additional minutes of instructional time to this course. This additional time is not correlated with any detectable improvement in student performance by using the NRQ format, nor do most students prefer these questions. From an instructor perspective, the continued use of NRQ in class is therefore not recommended if that time could be used more effectively with additional questions or other good pedagogical practices.
Using SRSs to study student perceptions of SRS usage has been demonstrated to be an effective SoTL strategy (Landrum, 2013). The major takeaway from this study is that using an SRS for novel calculations is highly regarded as effective by students, regardless of whether the question is given as a MCQ or NRQ, but students strongly prefer the MCQ format. Approximately 3 times as many students indicated that mathematical SRS questions should be assessed through the multiple choice question type compared to numerical response. The students did not appear to be inherently aware of the additional time expended as not a single comment indicated time as a factor. Instead, student comments indicated the similarity to examination questions in MCQ format as one of the identified factors contributing to that preference. This can be considered an example of constructive alignment, where formative assessments are similar in format to summative assessments (Biggs, 1996; Muldoon & Palm, 2008).
The other theme from the student comments was that numerical response questions were more difficult. The perception that multiple choice questions are less difficult may be because when students calculated an answer that was available as one of the given MCQ responses it increased their confidence that they were utilizing the calculation correctly. If a student produced an answer that was not one of the MCQ responses, they would have immediate feedback that there was an error in their procedure. With NRQ this chance for checking their answer before submission was not available unless students conferred with one another. This uncertainty may be measurable by the fact that for the questions in this study students changed their answers 17.0% of the time when MCQ were used versus 27.8% of the time when NRQ were used. Changing answers more often could be an indicator that students were less confident in their responses, which warrants further study. Overall, students still had quite a positive opinion of the usefulness of the NRQ format in learning, with a Likert score of 4.10/5, but this was less than their opinion of the Top Hat system’s overall effectiveness (4.31/5) or their opinion of the multiple choice questions (4.45/5).
This study agrees with a growing body of literature spanning many educational disciplines, showing students hold a strong positive opinion of using an SRS for formative assessment. Across STEM disciplines, such as nutrition (Gould, 2016), psychology (Landrum, 2013), dentistry (Llena et al., 2015), biology (Morrell & Joyce, 2015), and nursing (Patterson et al., 2010), researchers have demonstrated evidence for continued and expanded SRS usage. More interestingly, this study can provide instructors with some information on how to make pedagogical decisions around which SRS features to use—in this case testing mathematical concepts with numerical response or multiple choice question types. When introducing a new calculation, students may benefit from using multiple choice formatted questions to allow for answer-recognition to boost confidence. The added benefit of using MCQ is that class time will be saved, which can be used to ask subsequent questions, giving students more opportunities to apply their learning, or to spend more time going over common mistakes when discussing how students responded. Once student confidence is established, the NRQ may be utilized, using an SRS as a means to increase the difficulty of the question. Subsequent NRQ could be done in class or assigned as homework if the SRS has that capability. It is important to reiterate that SRSs are tools, and the only way to evaluate whether the tool is being used effectively is for instructors to gather specific feedback from students and be willing to test different configurations systematically while keeping in mind the need for constructive alignment between formative and summative assessments.
Continued research on SRS best practices is encouraged as adoption continues to expand across disciplines and features are added. Limitations to the research described include an inability to easily differentiate whether quick student responses constitute a placeholder or a guess—two strategies apparent at a granular level of detail. A placeholder response is submitted early to ensure a participation mark, followed by a revised submission once the student has completed the question. A guess is simply a low-effort response submitted (often quickly) with no further expectation of effort by the student. Alternate study designs could use SRS questions that allow only a single response, marks for correctness, or a specified length of time for responses to alter behaviours and better differentiate placeholder responses from guesses. As well, in courses where marks are given for correctness, students will likely employ different strategies when using their SRS. With more feature-rich technology, studies will also have the capability to monitor engagement through time spent on questions and the prevalence of response second-guessing. Student confidence levels by question type are an interesting contributor to their overall perceptions and will be included in future studies.
How to Cite
Anderson, K. (2021). As student response systems expand features and question types, multiple choice continues to be the gold standard for calculations from both student and instructor perspectives. Imagining SoTL, 1, 130 – 145. https://doi.org/10.29173/isotl538
Author Biography
Kyle Anderson is a teaching-stream Assistant Professor in the department of Biochemistry, Microbiology and Immunology at the University of Saskatchewan. His key SoTL interests are in making education more engaging and accessible to diverse learners as an early adopter of educational technologies.
References
Addison, S., Wright, A., & Milner, R. (2009). Using clickers to improve student engagement and performance in an introductory biochemistry class. Biochemistry and Molecular Biology Education, 37(2), 84–91. http://doi.org/10.1002/bmb.20264
Bedard, K., & Kuhn, P. (2008). Where class size really matters: Class size and student ratings of instructor effectiveness. Economics of Education Review, 27(3), 253–265. https://doi.org/10.1016/j.econedurev.2006.08.007
Biggs, J. (1996). Enhancing teaching through constructive alignment. Higher Education, 32(3), 347–364.
Caldwell, J. E. (2007). Clickers in the large classroom: Current research and best-practice tips. CBE Life Sciences Education, 6(1), 9–20. https://doi.org/10.1187/cbe.06-12-0205
Carini, R. M., Kuh, G. D., & Klein, S. P. (2006). Student engagement and student learning: Testing the linkages. Research in Higher Education, 47(1), 1–32. https://doi.org/10.1007/s11162-005-8150-9
Crouch, C. H., & Mazur, E. (2001). Peer instruction: Ten years of experience and results. American Journal of Physics, 69(9), 970–977. https://doi.org/10.1119/1.1374249
Eberlein, T., Kampmeier, J., Minderhout, V., Moog, R. S., Platt, T., Varma-Nelson, P., & White, H. B. (2008). Pedagogies of engagement in science: A comparison of BPL, POGIL, and PLTL. Biochemistry and Molecular Biology Education, 36(4), 262–273. https://doi.org/10.1002/bmb.20204
Ebert-May, D., Brewer, C., & Allred, S. (1997). Innovation in large lectures: Teaching for active learning. Bioscience, 47(9), 601–607. https://doi.org/10.2307/1313166
Geske, J. (1992). Overcoming the drawbacks of the large lecture class. College Teaching, 40(4), 151–154.
Gould, S. M. (2016). Potential use of classroom response systems (CRS, clickers) in foods, nutrition, and dietetics higher education. Journal of Nutritional Education and Behavior, 48(9), 669–674.e1. https://doi.org/10.1016/j.jneb.2016.06.004
Han, J. H. (2014). Closing the missing links and opening the relationships among the factors: A literature review on the use of clicker technology using the 3P model. Educational Technology & Society, 17(4), 150–168.
Keough, S. M. (2012). Clickers in the classroom: A review and a replication. Journal of Management Education, 36(6), 822–847. https://doi.org/10.1177/1052562912454808
Kuh, G. D. (2003). What we're learning about student engagement from NSSE: Benchmarks for effective educational practices. Change: The Magazine of Higher Learning, 35(2), 24–32. https://doi.org/10.1080/00091380309604090
Landrum, R. E. (2013). The ubiquitous clicker: SoTL applications for scientist–educators. Teaching of Psychology, 40(2), 98–103. https://doi.org/10.1177/0098628312475028
Landrum, R. E. (2015). Teacher-ready research review: Clickers. Scholarship of Teaching and Learning in Psychology, 1(3), 250–254. https://doi.org/10.1037/stl0000031
Lane, D. M., & Atlas, R. S. (1996, March). The networked classroom [Paper presentation]. The 1996 Meeting of Computers and Psychology, York, UK.
Levine, A. E. (2011). Correlation between clicker scores and examination performance in dental biochemistry. Medical Science Educator, 21(4), 326–329. https://doi.org/10.1007/bf03341731
Llena, C., Forner, L., & Cueva, R. (2015). Student evaluation of clickers in a dental pathology course. Journal of Clinical and Experimental Dentistry, 7(3), e369–e373. https://doi.org/10.4317/jced.52299
Masikunas, G., Panayiotidis, A., & Burke, L. (2007). The use of electronic voting systems in lectures within business and marketing: A case study of their impact on student learning. ALT-J, Research in Learning Technology, 15(1), 3–20. https://doi.org/10.3402/rlt.v15i1.10903
Miles, N. G., & Soares da Costa, T. P. (2016). Acceptance of clickers in a large multimodal biochemistry class as determined by student evaluations of teaching: Are they just an annoying distraction for distance students? Biochemistry and Molecular Biology Education, 44(1), 99–108. https://doi.org/10.1002/bmb.20917
Monks, J., & Schmidt, R. (2010). The impact of class size and number of students on outcomes in higher education. Cornell Higher Education Research Institute, Cornell University. https://digitalcommons.ilr.cornell.edu/workingpapers/114/
Morrell, L. J., & Joyce, D. A. (2015). Interactive lectures: Clickers or personal devices? F1000 Research, 4, 1–12. https://doi.org/10.12688/f1000research.6207.1
Muldoon, N., & Palm, C. (2008). Formative and summative assessment and the notion of constructive alignment. In S. Frankland (Ed.), Enhancing teaching and learning through assessment (pp. 96–106). Springer.
Patterson, B., Kilpatrick, J., & Woebkenberg, E. (2010). Evidence for teaching practice: The impact of clickers in a large classroom environment. Nurse Education Today, 30(7), 603–607. https://doi.org/10.1016/j.nedt.2009.12.008
Rana, N. P., & Dwivedi, Y. K. (2017). Can clicking promote learning? Measuring student learning performance using clickers in the undergraduate information systems class. Journal of International Education in Business, 10(2), 201–215. https://doi.org/10.1108/JIEB-06-2016-0010
Sapelli, C., & Illanes, G. (2016). Class size and teacher effects in higher education. Economics of Education Review, 52, 19–28. https://doi.org/10.1016/j.econedurev.2016.01.001
Smith, C. V., & Cardaciotto, L. (2011). Is active learning like broccoli? Student perceptions of active learning in large lecture classes. Journal of the Scholarship of Teaching and Learning, 11(1).
Statistics Canada. (2020). Table 37-10-0018-01 Postsecondary enrolments, by registration status, institution type, status of student in Canada, and gender. https://doi.org/10.25318/3710001801-eng
Stevens, N. T., McDermott, H., Boland, F., Pawlikowska, T., & Humphreys, H. (2017). A comparative study: Do "clickers" increase student engagement in multidisciplinary clinical microbiology teaching? BMC Med Educ, 17(1), 1–8. https://doi.org/10.1186/s12909-017-0906-3